Troubleshooting
The following steps describe typical flow when troubleshooting any DPA-S related issues you may encounter.
First, note that your Dataproc Spark cluster setup running in a GCP environment has multiple components and the DPA-S plugin comes into play only during execution of queries. So, first and foremost, look for any error logs and hints from the error messages to isolate the problem to the right component that may be causing the problem.
You should use any of your standard troubleshooting practices and resources (such as Spark logs, Dataproc logs, community forums) for identifying the root cause, and subsequently an appropriate solution. Below we list a few generic resources:
If the error messages include names such as ‘Velox’, ‘Gluten’, ‘DataPelago’, ‘DPA’, then the failure may be related to DPA-S. In such case, check if you have hit any of the error scenarios described in the following sub-sections. If so, try to resolve the issue by following the suggested solutions.
If the issue is still not resolved, then contact DataPelago Support at support@datapelago.com with the following details:
Details about the problem, the environment, scenario, and steps that led to the problem.
Error messages, and any other details indicating the problem is related to DPA-S.
Sequence of steps to reproduce the problem.
1. Finding DPA-S Plugin Version and Environment Details
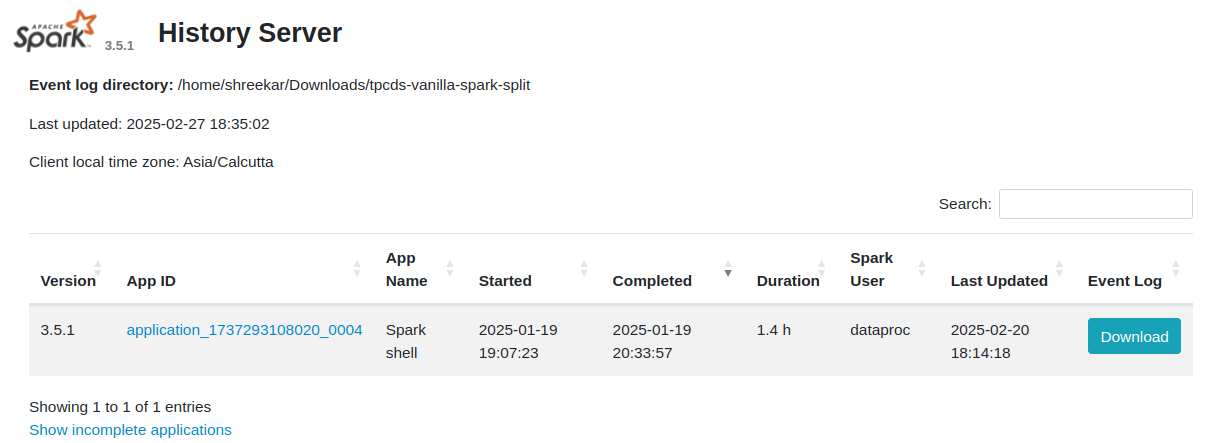
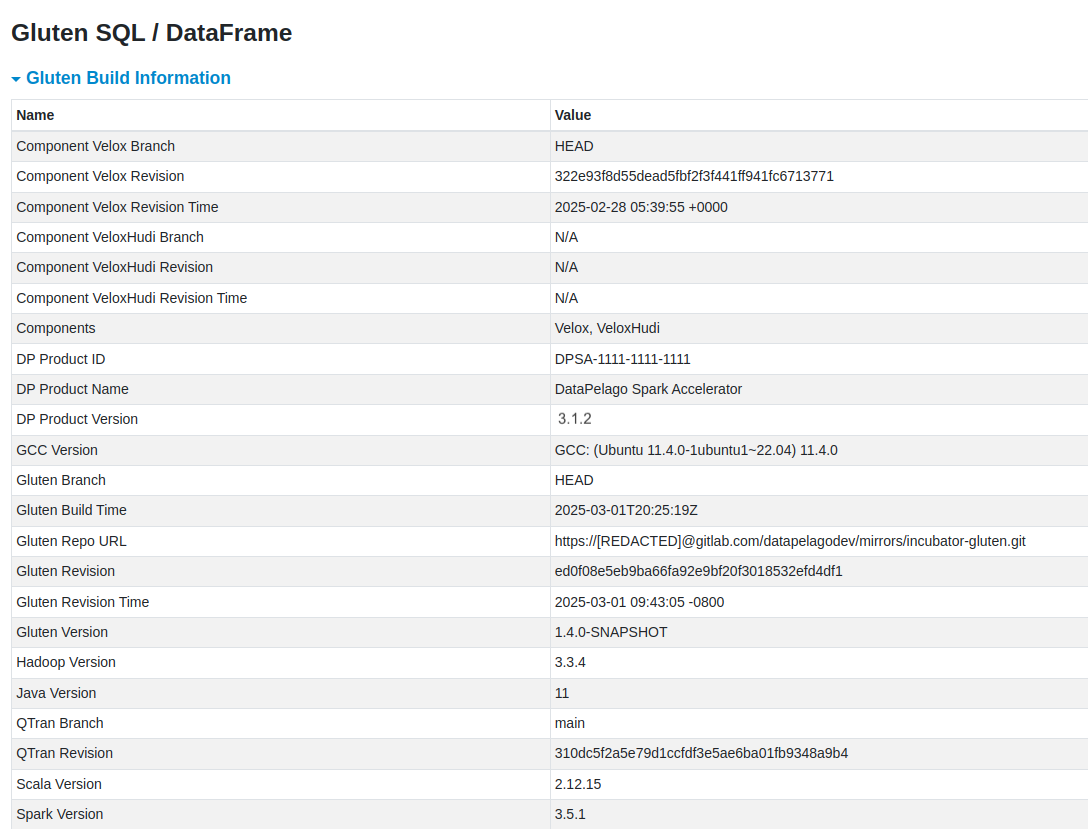
To find details about the DPA-S plugin such as version, product ID etc are available in the Spark History Server → <your Application details> →Gluten SQL/DataFrame Tab → Gluten Build Information section.
Note
You must have set the Spark setting spark.gluten.ui.enabled to true, to enable the Gluten SQL/DataFrame tab in the Spark UI
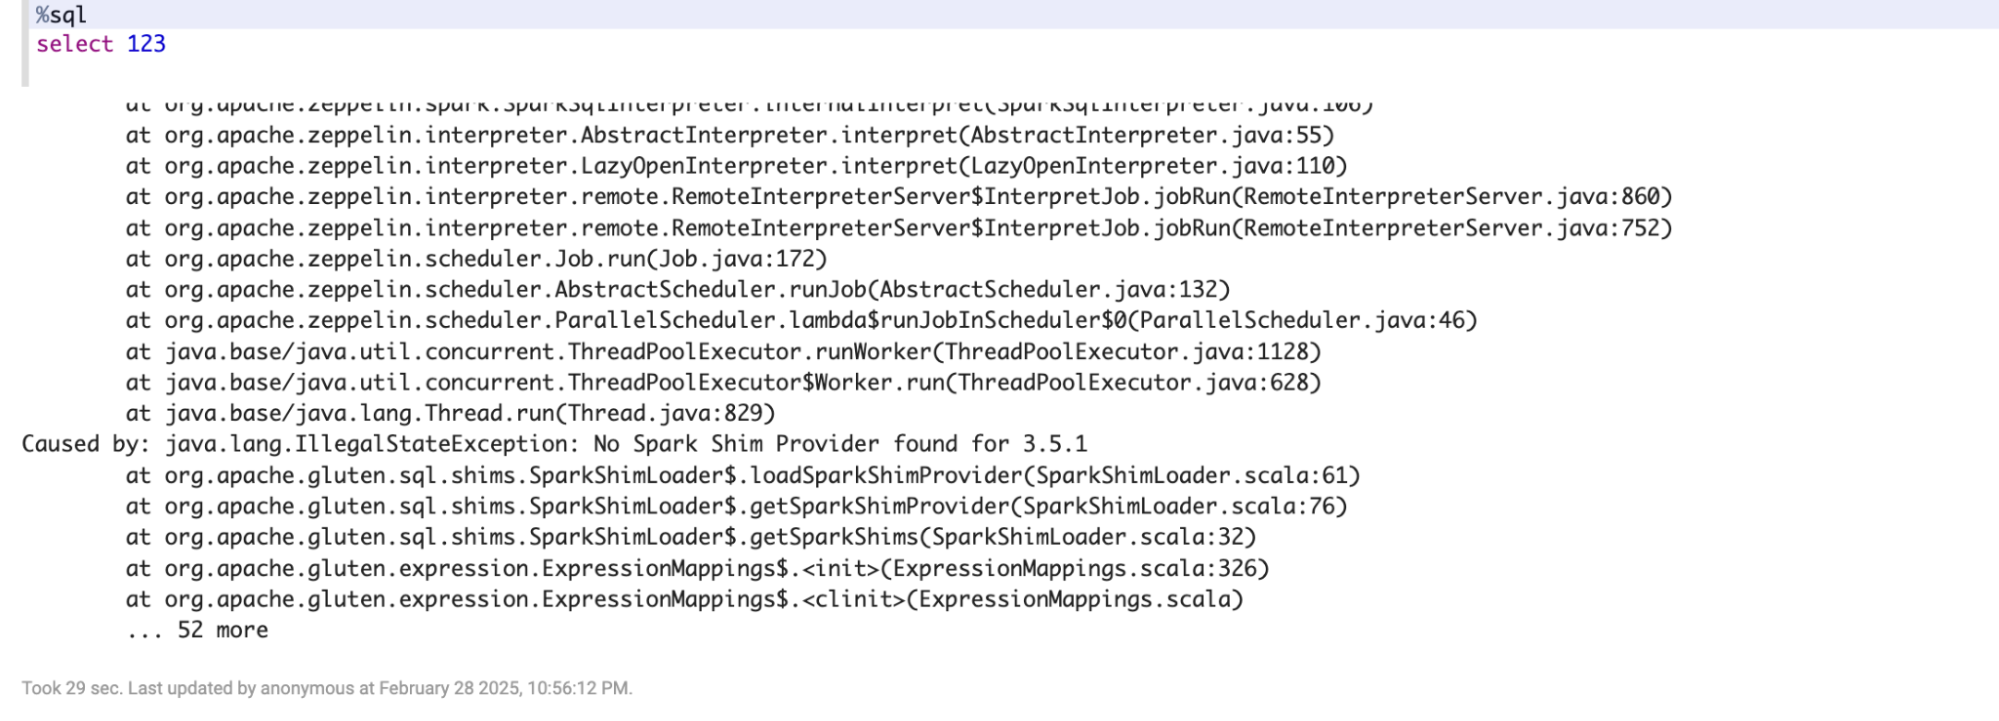
2. DPA-S Load Error
Cluster creation or start of a cluster throws error because it fails to load the the DPA-S init action script or .jar files (for example due to incorrect path)
Result: Cluster creation/starting fails with specific error in the logs.
Solution:
This error may occur because of unavailable or inaccessible DPA-S release package binaries. Or, there may be a problem when loading the relevant files as part of creating or starting the cluster.
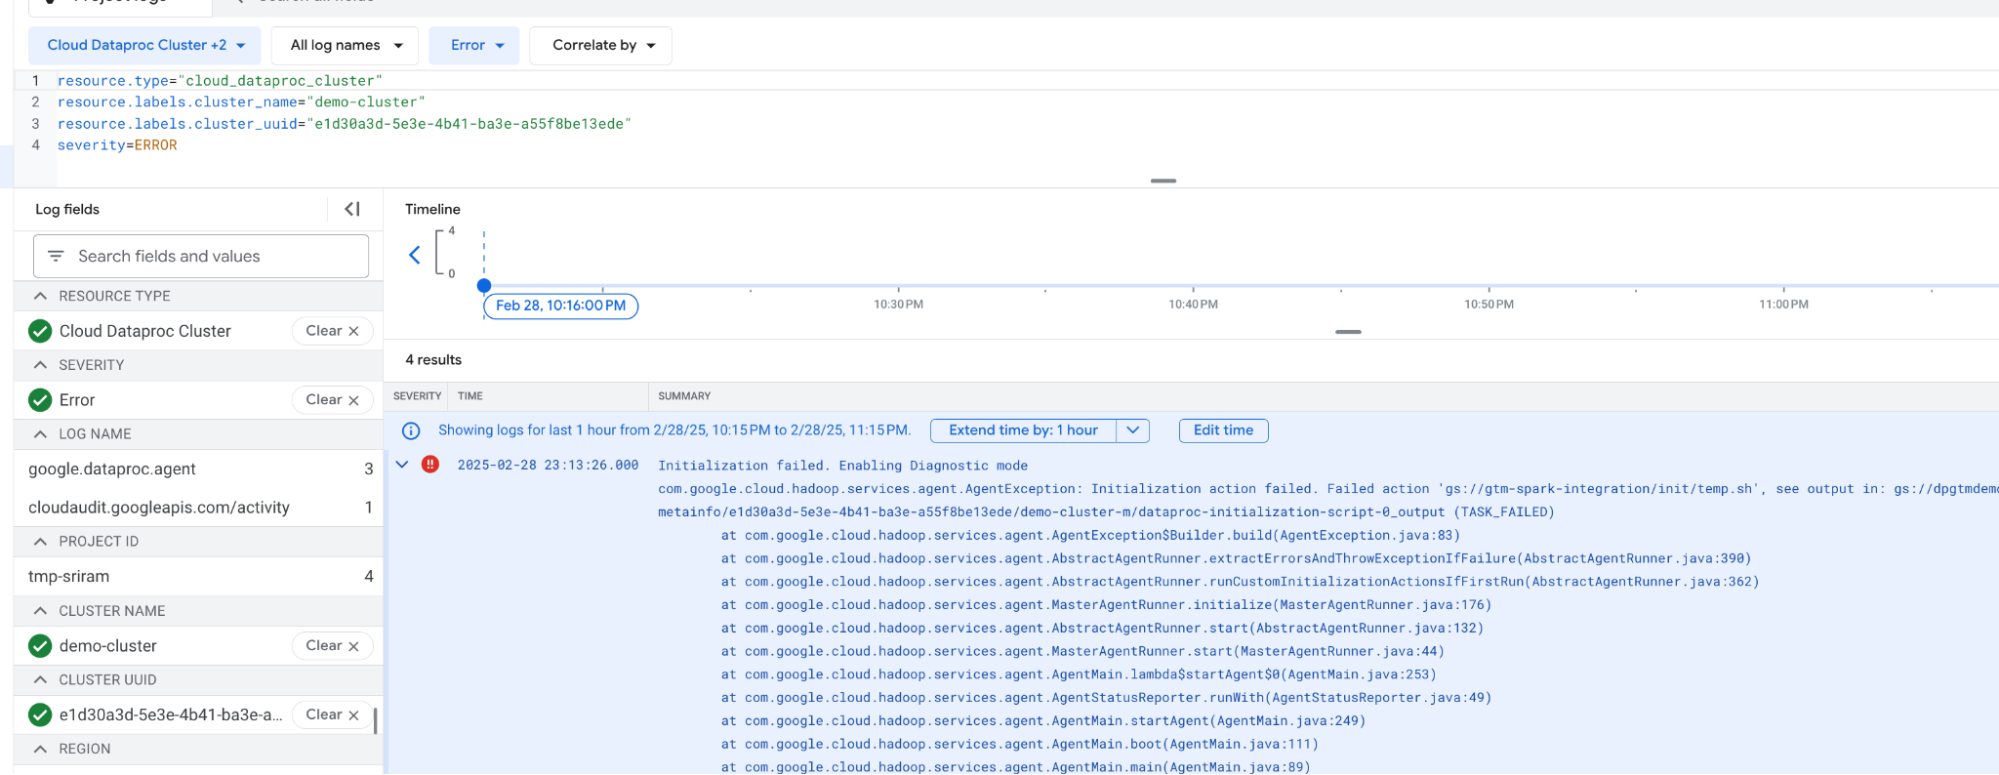
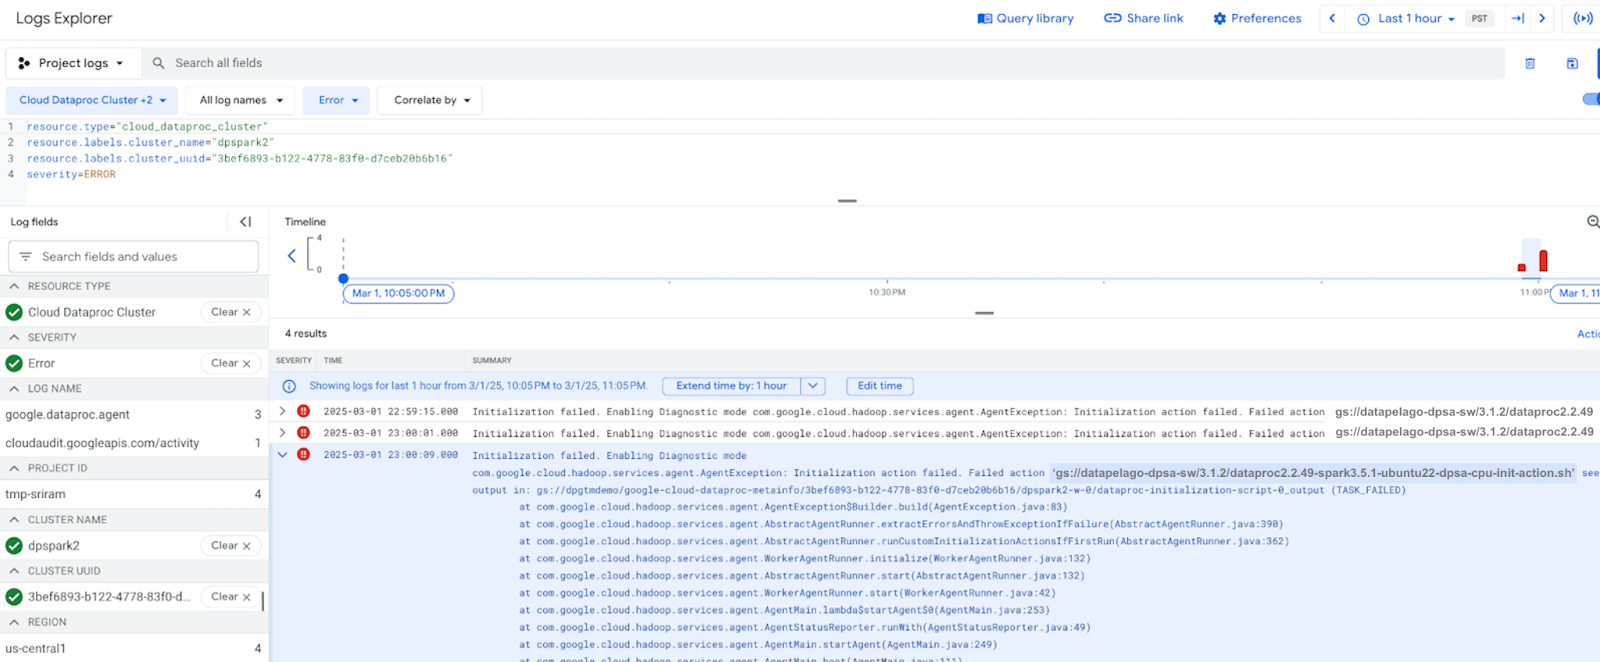
Check for any errors in the log messages in the CLI (command line tool) where the cluster is launched, or from the Cloud Logging console of the related Dataproc cluster. DPA-S is deployed using an Initialization action script. Each Initialization action creates its own log file whose path is printed in the Cloud Logging console, as shown below.
Take appropriate action to resolve the error. For example:
If the failure seems to be related to other GCP/Dataproc actions, refer to respective documentation or support for trouble shooting/fix the issue.
Make sure the DPA-S package files are available and accessible in the specified path.
If the initialization action logs indicate an issue with the DataPelago/DPA-S plugin binaries, contact DataPelago Support at support@datapelago.com.
ERROR: (gcloud.dataproc.clusters.create) NOT_FOUND: Google Cloud Storage object does not exist 'gs://datapelago-dpsa-sw/3.1.7/dataproc2.2.49-spark3.5.1-ubuntu22-dpsa-cpu-init-actions1.sh'
3. Corrupted or Incompatiable DPA-S Release Package Files
Cluster creation or start of a cluster throws error because of missing, corrupted, or incompatible DPA-S release package files, such as init-action.sh or .jar files.
Result: Spark Launch fails
Solution:
This error may occur if the DPA-S release package files are corrupted, or the specified release package binaries are incompatible with the specific Dataproc, OS, or Spark versions. For example, you may see the following error.
Make sure you specified the correct versioned DPA-S init-action.sh file matching the Dataproc image version, OS type etc. selected during cluster creation command.
For example, if you have specified the script
gs://datapelago-dpsa-sw/3.1.7/dataproc2.2.49-spark3.5.1-ubuntu22-dpsa-cpu-init-actions1.sh
then, make sure you have indeed selected dataproc version 2.2 ubuntu22 image with Spark 3.5.1.
If the above steps don’t resolve the issue, contact DataPelago Support at support@datapelago.com.
4. Insufficient Privileges to Access or Run DPA-S
The service account or principal creating the cluster may not have sufficient permissions to run the DPA-S init-action.sh script. Result: Cluster creation fails with specific error in the logs. Solution:
This error may occur because of unavailable or inaccessible DPA-S release package binaries. Or, there may be a problem when loading the relevant files as part of creating or starting the cluster.
Check for any errors in the log messages in the CLI (command line tool) where the cluster is launched, or from the Cloud Logging console of the related Dataproc cluster.
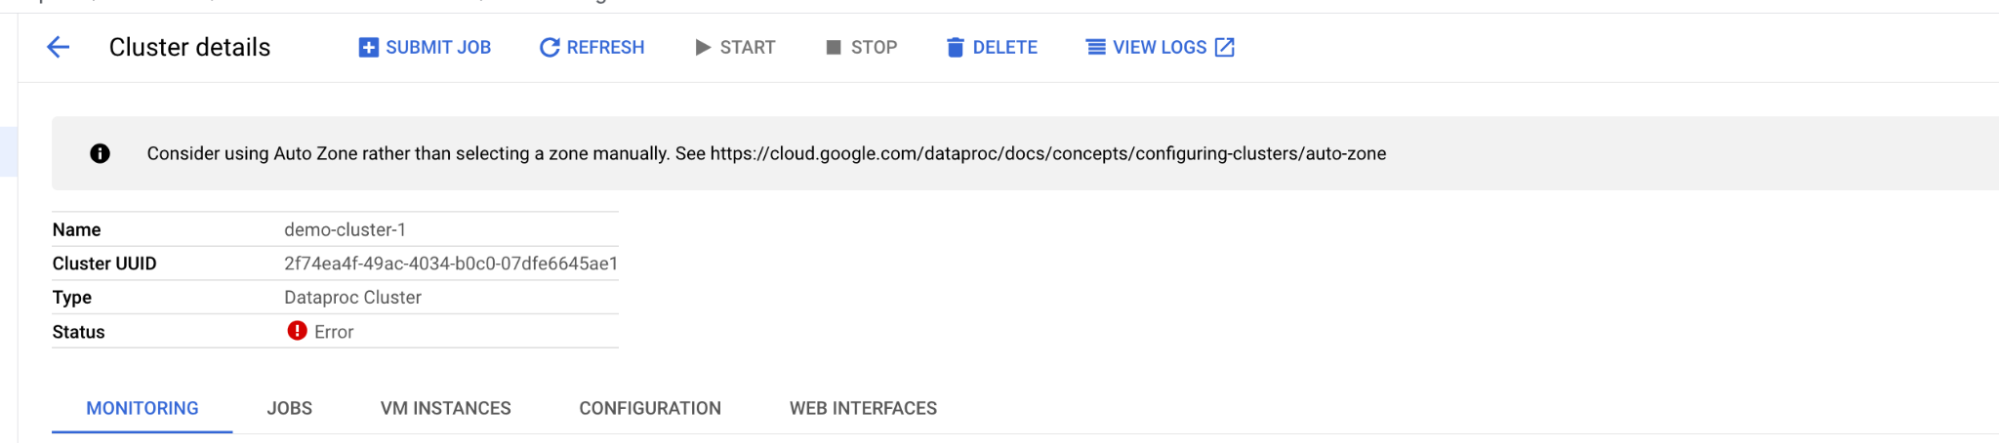
gcloud.dataproc.clusters.create) Operation [projects/tmp-prj/regions/us-central1/operations/2e27f283-024b-3955-97a3-c36ddae97dbc] failed: Multiple Errors:
- Initialization action failed. Failed action 'gs://datapelago-dpsa-sw/3.1.7/dataproc2.2.49-spark3.5.1-ubuntu22-dpsa-cpu-init-actions1.sh', see output in: gs://dpgtmdemo/google-cloud-dataproc-metainfo/2f74ea4f-49ac-4034-b0c0-07dfe6645ae1/demo-cluster-1-m/dataproc-initialization-script-0_output
- Initialization action failed. Failed action 'gs://datapelago-dpsa-sw/3.1.7/dataproc2.2.49-spark3.5.1-ubuntu22-dpsa-cpu-init-actions1.sh', see output in: gs://dpgtmdemo/google-cloud-dataproc-metainfo/2f74ea4f-49ac-4034-b0c0-07dfe6645ae1/demo-cluster-1-w-0/dataproc-initialization-script-0_output
Error messages from the log file
>>gsutil cat gs://dpgtmdemo/google-cloud-dataproc-metainfo/2f74ea4f-49ac-4034-b0c0-07dfe6645ae1/demo-cluster-1-m/dataproc-initialization-script-0_output

{"level":"ERROR","timestamp":"2025-03-01T19:04:06.713Z","message":"error-code=0104: error in validating certificate. cert fetching failed: failed to create cert object reader: googleapi: got HTTP response code 403 with body: <?xml version='1.0' encoding='UTF-8'?><Error><Code>AccessDenied</Code><Message>Access denied.</Message><Details>872690965693-compute@developer.gserviceaccount.com does not have storage.objects.get access to the Google Cloud Storage object. Permission 'storage.objects.get' denied on resource (or it may not exist).</Details></Error>","lineNumber":"/builds/datapelagodev/Service/datapelagodev/cloud/agent/licensecheck.go:65"}
{"level":"ERROR","timestamp":"2025-03-01T19:04:06.713Z","message":"Invalid license state","lineNumber":"/builds/datapelagodev/Service/datapelagodev/cloud/agent/main.go:74"}
Datapelago agent checks has failed. Exiting Dataproc cluster initialization.
5. License Verification Fails
Result: Cluster creation/starting fails, or running cluster may throw specific error in the logs. In this case, DPA-S may fail, but the Spark cluster may continue to run with DPA-S disabled and no perf acceleration.
Solution:
License check may fail because of various reasons such as:
unauthorized Org/projects/principals are trying to run the DPA-S.
Invalid license path or subscriptionID is provided (config settings)
License is expired
Transient network errors or other failures while DPA-S is trying to verify the license.
For example, following log messages show invalid license error
{"level":"ERROR","timestamp":"2025-03-02T06:59:14.638Z","message":"error-code=0104: error in validating certificate. cert fetching failed: failed to create cert object reader: storage: object doesn't exist","lineNumber":"/builds/datapelagodev/Service/datapelagodev/cloud/agent/licensecheck.go:65"}

{"level":"ERROR","timestamp":"2025-03-02T06:59:14.638Z","message":"Invalid license state","lineNumber":"/builds/datapelagodev/Service/datapelagodev/cloud/agent/main.go:74"}

Datapelago agent checks has failed. Exiting Dataproc cluster initialization.
In any of the above scenarios, try an appropriate solution as per the indicated error messages in the Spark logs made available in the Cloud Console.
If you are hitting transient errors (such as network failure), retrying the action may resolve the issue.
If the failure seems to be related to GCP/Dataproc, refer to respective documentation to fix it, or support troubleshooting the issue.
If the failure seems to be related to DataPelago/DPA-S, and no clear resolution is available, then contact DataPelago Support.
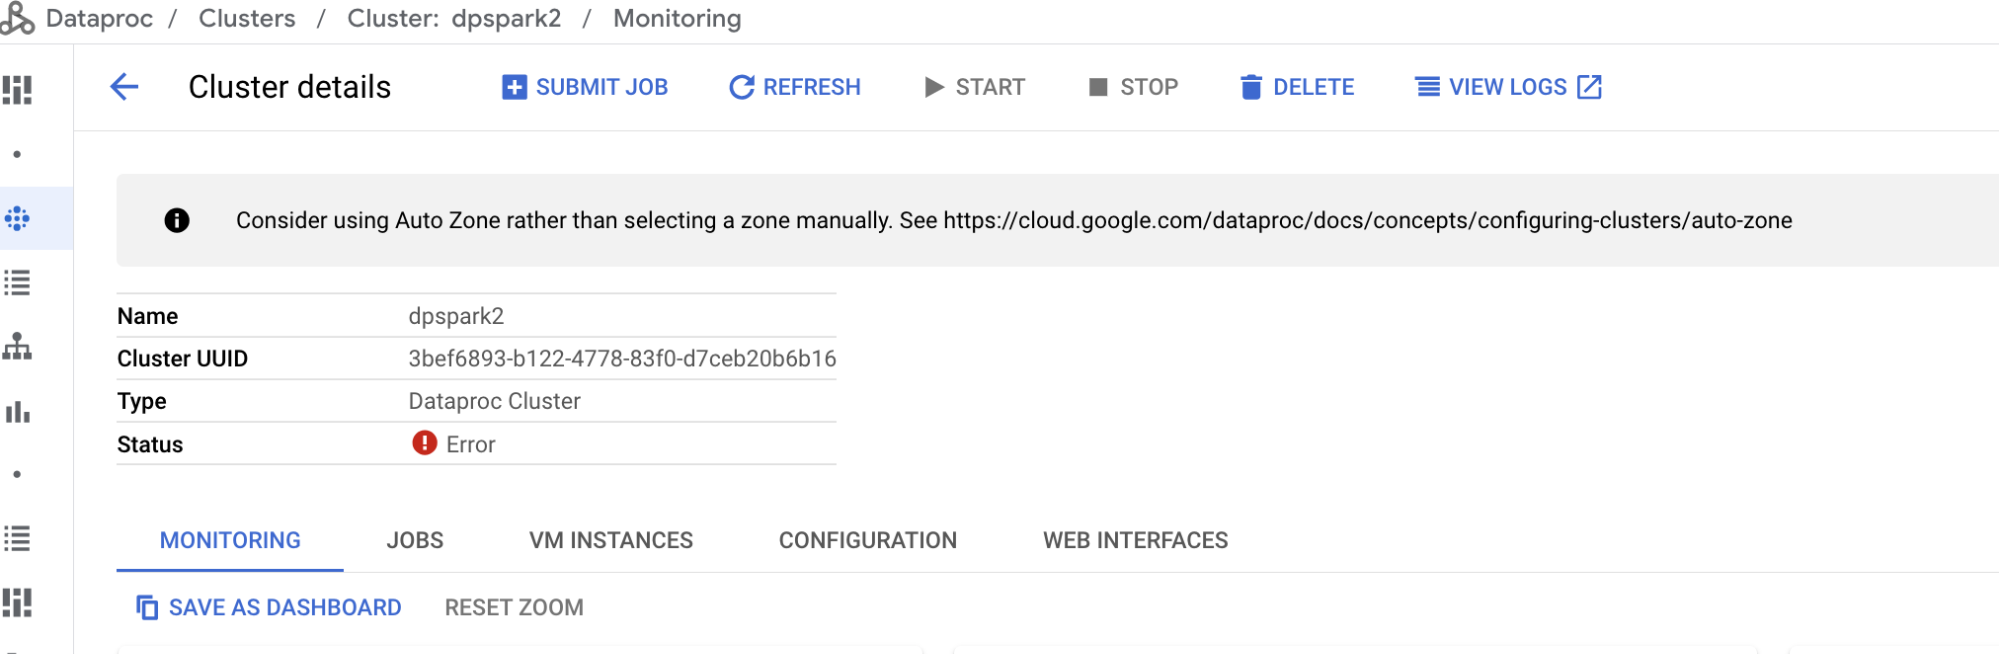
6. Invalid Subscription ID
Result: the operation that involved the subscriptID may fail.
Solution:
Double check the subscriptionID is exactly the same as the one provided by SE as part of the subscription/onboarding process. Refer to the documentation “log explorer” section.
Contact DataPelago Support at support@datapelago.com if the issue is not resolved.
>>gsutil cat gs://dpgtmdemo/google-cloud-dataproc-metainfo/3bef6893-b122-4778-83f0-d7ceb20b6b16/dpspark2-m/dataproc-initialization-script-0_output

Operation completed over 1 objects/8.1 KiB.
{"level":"INFO","timestamp":"2025-03-02T06:59:14.482Z","message":"Product id is DPSA-1111-1111-1111","lineNumber":"/builds/datapelagodev/Service/datapelagodev/cloud/agent/main.go:29"}
{"level":"ERROR","timestamp":"2025-03-02T06:59:14.638Z","message":"error-code=0104: error in validating certificate. cert fetching failed: failed to create cert object reader: storage: object doesn't exist","lineNumber":"/builds/datapelagodev/Service/datapelagodev/cloud/agent/licensecheck.go:65"}
{"level":"ERROR","timestamp":"2025-03-02T06:59:14.638Z","message":"Invalid license state","lineNumber":"/builds/datapelagodev/Service/datapelagodev/cloud/agent/main.go:74"}
Datapelago agent checks has failed. Exiting Dataproc cluster initialization.
7. Segmentation Fault Errors in DPA-S Components
Segmentation fault errors may rarely occur at runtime, and mostly these are related to some form of bug in the product.
Result: Spark or DPA-S processes may get killed abruptly and the Spark jobs/queries fail to complete successfully.
Diagnosis Steps:
Segmentation fault errors are logged in the system logs on the Spark master or worker node instances. Use the following commands to check for segmentation fault messages on each of the cluster nodes.
sudo grep -i -E 'segmentation fault|segfault' /var/log/syslog
    or
sudo dmesg | grep -i -E 'segmentation fault|segfault'
Look for error messages following pattern similar to:
segfault at <address> ip <instruction pointer>
When checking Spark logs for segmentation fault errors, look for error messages following patterns similar to:
Segmentation fault (core dumped)
ExecutorLostFailure: Executor 3 exited due to a segmentation fault
Solution:
Check for the core dump files on all the spark worker nodes where the segmentation fault errors occurred.
Core dump files are typically available at the following location. This may differ by Operating System type, in which case check your OS documentation.
/proc/sys/kernel/core_pattern
If core dumps are not captured at the above mentioned location, run following command (or equivalent tool in your OS) to check/enable core dumps:
ulimit -c unlimited
Collect the core dumps and share
If you see segmentation faults or stacktraces related to DPA-S components, then reach out to the DataPelago support team at support@datapelago.com.
8. Find the operators accelerated using DPA-S
When you run a workload on a Dataproc cluster, the DPA-S plugin will identify and accelerate the execution of the query plan based on various factors, such as supported operators for acceleration, available resources, and overall expected performance benefit.
You can use the following steps to find out which parts of your workload & queries are actually accelerated using DPA-S.
Navigate to the Spark History Server of your Spark cluster.
In Spark History Server -> Gluten SQL/DataFrame Tab, for each query that is run in the application, the Num Gluten Nodes columns indicates how many operators are accelerated by DPA-S, and the Num Fallback Nodes column indicates how many operators execution fellback and ran on the Spark JVM.
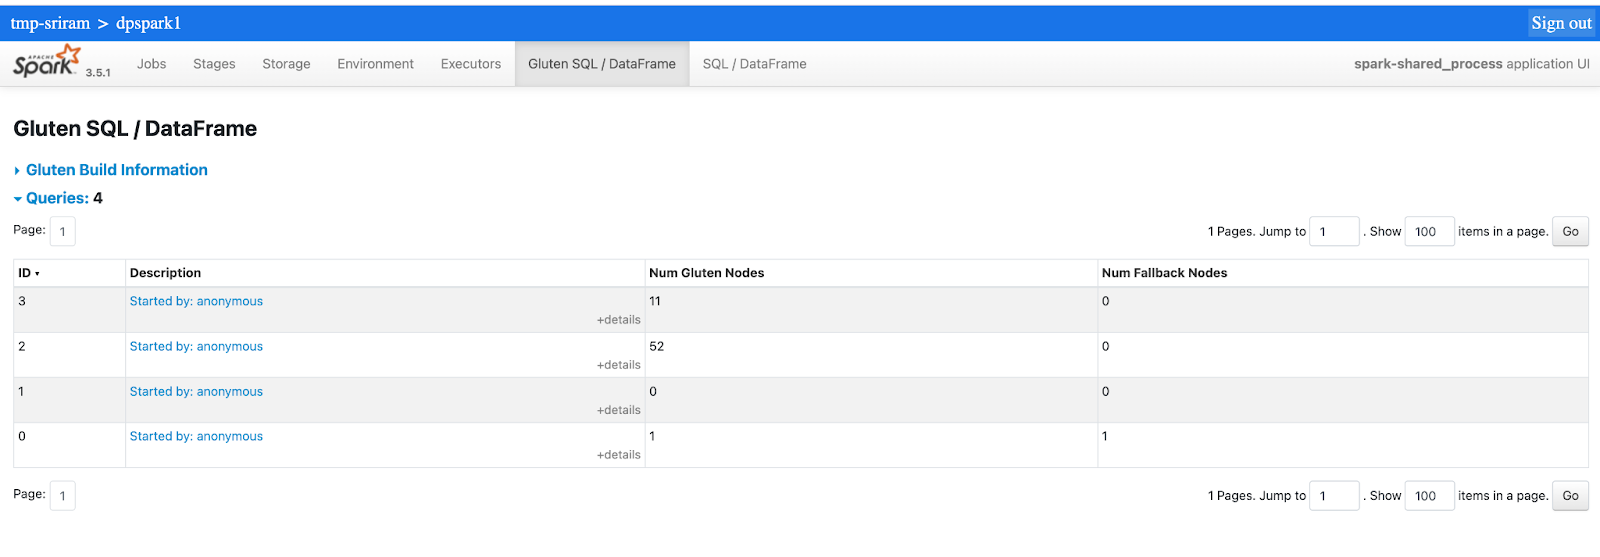
Click on the Description link of a query to see the details of all the nodes of that query.
9. Queries Running Slowly
Solution:
View the spark configuration parameters used to run the application as described in config.
Compare the spark configuration parameter values with the mandatory / recommended values as described in Deployment section and fix any configuration values that are inappropriate.
Make sure queries are getting offloaded to DPA-S components Gluten/Velox (by looking at Num Fallback Nodes as mentioned in section Find the operators accelerated using DPA-S.
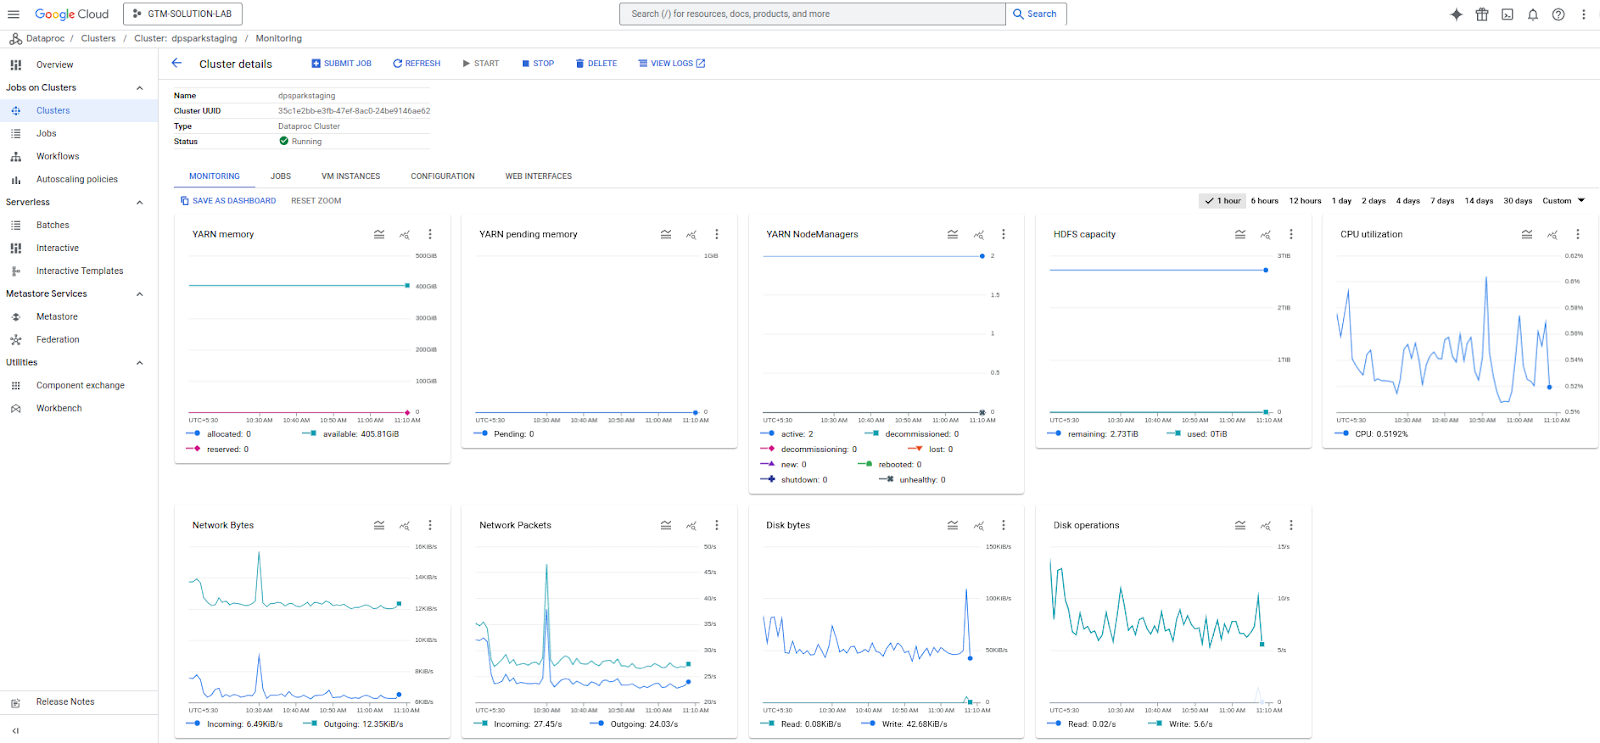
Check system resource utilization (like disk and memory) while running the query in the cluster monitoring tab as shown below. For example,
If any of the specific resources is being utilized to the full available capacity, it could mean that the available resources may not be enough to successfully complete the query.
Consider increasing the constrained resource (which may have become a bottleneck, or increase the number of nodes in the cluster.